
Liquefaction Hazard Map of the Province of Batangas
 |
| Image source: Philippine Institute of Volcanology and Seismology. |
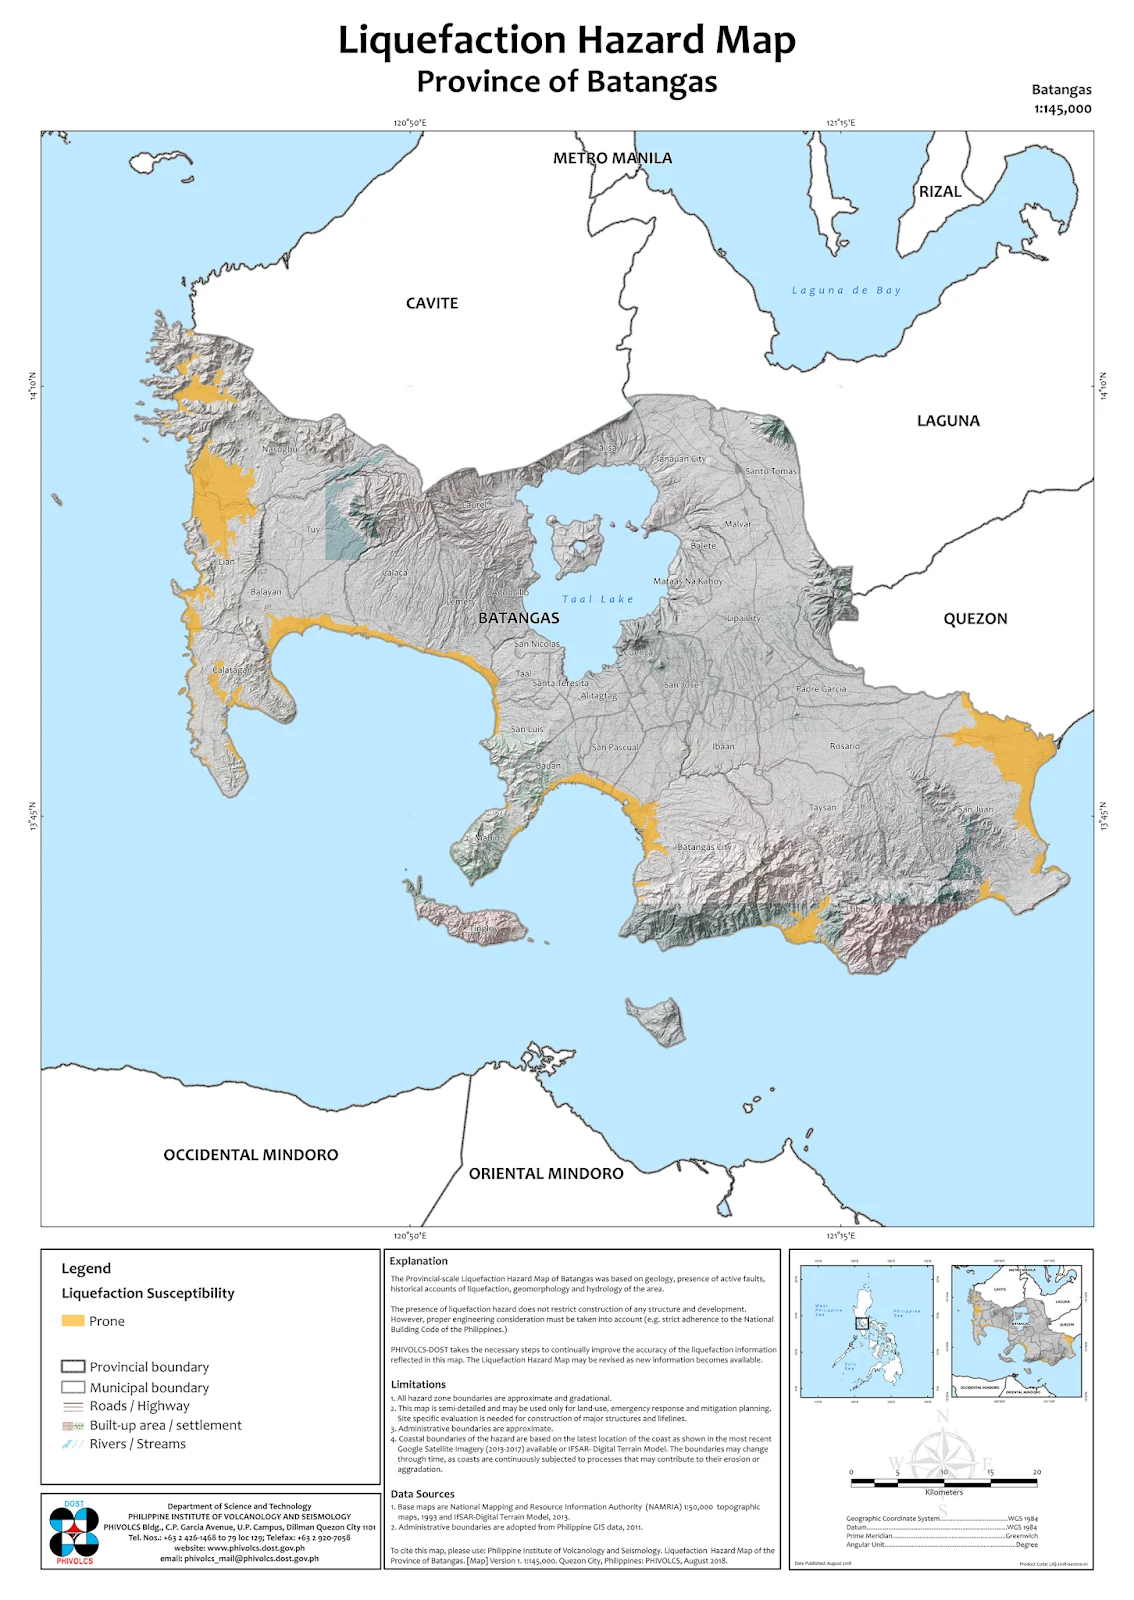
Above is the Liquefaction Hazard Map for the Province of Batangas originally taken from the official web site of the Philippine Institute of Volcanology and Seismology (PHIVOLCS)1. It has been converted to .jpg format from .png and resized to 2,000 x 2,821 pixels for quicker download.
The original file higher resolution .png file with dimensions of 3,510 x 4,950 pixels may be downloaded from the PHIVOLCS web site. Please click on the link below:
CLICK: Liquefaction Hazard Map of the Province of Batangas
According to Wikipedia2, liquefaction “occurs when a saturated or partially saturated soil substantially loses strength and stiffness in response to an applied stress such as shaking during an earthquake or other sudden change in stress condition, in which material that is ordinarily a solid behaves like a liquid.”
The same Wikipedia item says that the phenomenon tends to occur in areas with “moderately granular soils with poor drainage” such as can be found in “stream beds, beaches and dunes.” Hence, in the liquefaction map above, the areas susceptible in Batangas, shown in orange, are all in or close to coastal areas.
PHIVOLCS provides the following literature in the map:
EXPLANATION
The Provincial-scale Liquefaction Hazard Map was based on geology, presence of active faults, historical accounts of liquefaction, geomorphology3 and hydrology4 of the area.
The presence of liquefaction hazard does not restrict construction of any structure and development. However, proper engineering consideration must be taken into account (e.g. strict adherence to the National Building Code of the Philippines).
PHIVOLCS-DOST takes the necessary steps to continually improve the accuracy of the liquefaction information reflected in this map. The Liquefaction Hazard Map may be revised as new information becomes available.
LIMITATIONS
- All hazard zone boundaries are approximate and gradational.
- This map is semi-detailed and may be used only for land-use, emergency response and mitigation planning. Site specific evaluation is needed for construction of major structures and lifelines.
- Administrative boundaries are approximate.
- Coastal boundaries of the hazard are based on the latest location of the coast as shown in the most recent Google Satellite imagery (2013-2017) available or IfSAR-Digital Terrain Model. The boundaries may change through time, as coasts are continually subjected to processes that may contribute to their erosion or aggradation.
DATA SOURCES
- Base maps are National Mapping and Resource Information Authority (NAMRIA) 1:50,000 topographic maps. 1993 and IfSAR Digital Terrain Model, 2013.
- Administrative boundaries are adopted from Philippine GIS data, 2011.
Citations
To cite this map, please use: Philippine Institute of Volcanology and Seismology. Liquefaction Hazard Map of the Province of Batangas. [Map] Version 1. 1:145,000. Quezon City, Philippines: PHIVOLCS, August 2018.
2 “Soil Liquefaction,” Wikipedia.
3 Geomorphology “is the scientific study of the origin and evolution of topographic and bathymetric features created by physical, chemical or biological processes operating at or near the Earth's surface.” Wikipedia.
4 Hydrology “is the scientific study of the movement, distribution, and quality of water on Earth and other planets, including the water cycle.” Wikipedia.