
Tsunami-Prone Areas in Batangas as Shown by a Phivolcs Hazard Map
Right after the magnitude 5.4 earthquake that hit just off the island of Tingloy on the 4th of April 2017, subsequent news reports showed clips of Batangas City-residents along the coastal areas hurrying off to higher grounds. Some of these were also sent scampering because of bogus text messages that warned of the impending arrival of a tsunami. The Philippine Institute of Volcanology and Seismology or Phivolcs quickly moved to allay people’s fears. The strength of the earthquake, Phivolcs spokespersons told media, was not strong enough to have generated a tsunami.
In truth, Phivolcs has been extensively studying possible tsunami scenarios in the Philippines using a simulation software called Rapid Earthquake Damage Assessment System or REDAS.1 With the help of this software, Phivolcs has developed tsunami hazard maps which are viewable at the institute’s web site. The maps are used by local governments for disaster mitigation.
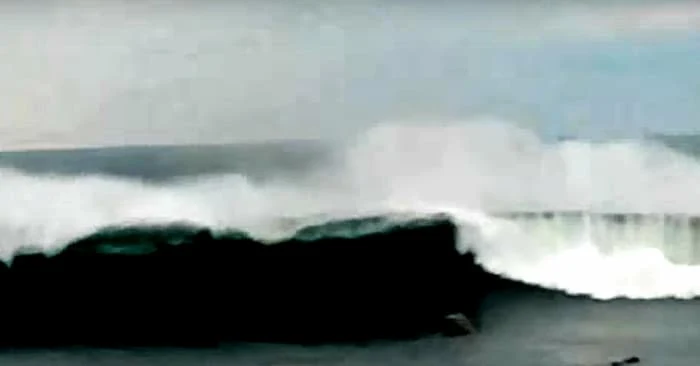 |
| Image captured by video posted by TD Interesting Topics Tube on YouTube. |
About the Hazard Map
This article aims to assist Phivolcs disseminate information about tsunami-prone areas in Batangas by featuring the REDAS-developed map for the province.2 To better appreciate the map, please read and understand the explanations given by Phivolcs about it below. The more technical terms are defined in the notes section at the bottom of this page.
- The hazard map to be used in this article is an enhancement of the 2007 Phivolcs Tsunami Hazard Map.
- The original indicative map was based on maximum computed wave heights and inundation (flooding) using possible worst-case scenarios from major off-shore source zones (identified underwater faults3 and trenches).
- For Batangas Province, the tsunami wave heights and inundation extent were previously computed based on a magnitude 8.2 shallow-depth earthquake4 along the Manila Trench5.
- The inundation extent of the 2007 Phivolcs Tsunami Hazard Map was determined using pre-1990 1:50,000 topographic maps. In the 2016 tsunami hazard maps, the inundation extent is based on data from 2013 Interferometric Synthetic Aperture Radar Digital Terrain Model6.
- It is assumed that the areas to be inundated are grasslands.
- The modeling was based on the assumption of a major movement of the Manila Trench and does not include tsunamis that may be generated by landslides and submarine volcanic eruptions. High/low tide and storm surge effects are also not reflected in the modeling, and geopolitical boundaries are approximate.
The Manila Trench
The REDAS simulation used to generate the hazard map assumed a magnitude 8.2 earthquake generated by a movement of the Manila Trench. To help readers visualize this oceanic trench, a graphic image is shown below. The trench is represented by the crooked line with triangular spikes due west of Luzon or to the left of the image.
 |
| Publication: Analysis of Oblique Plate Convergence along the Manila Trench and the Philippine Trench. Available from: ResearchGate. [accessed May 3, 2017] |
The Complete Batangas Tsunami Hazard Map
Below is the complete Batangas Tsunami Hazard Map from Phivolcs. The original file was 1:130,000 but the map below is a reduced version for quicker download. A color legend is provided below the map to help readers interpret the map. Each color represents the expected inundation or flooding in meters that may occur as a result of the tsunami. To download the original map, please visit the Phivolcs web site.
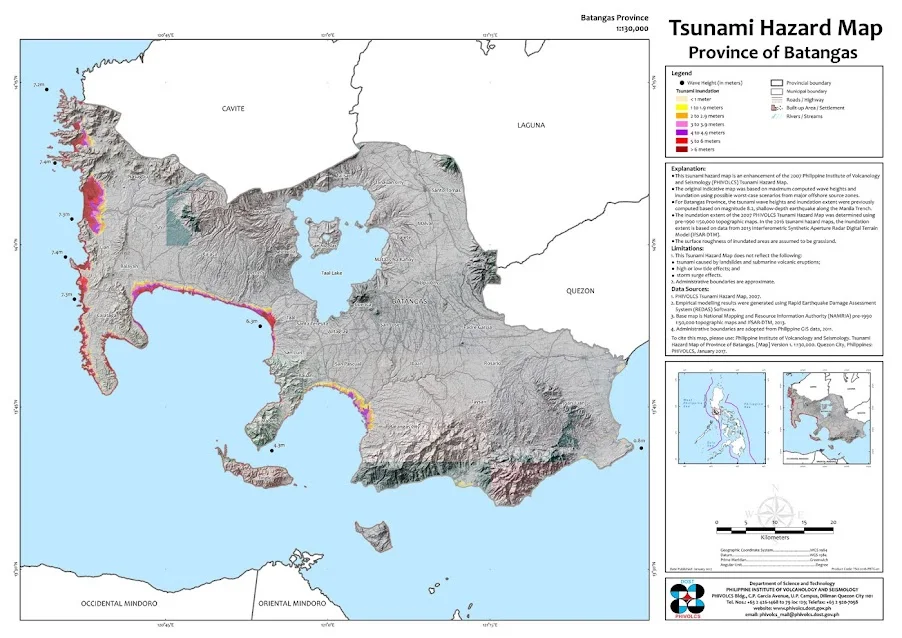 |
| Philippine Institute of Volcanology and Seismology, Tsunami Hazard Map of Province of Batangas. [Map] Version 1. Originally 1:130,000. Quezon City, Philippines: Phivolcs, January 2017. This is a reduced version of the original map. |
 |
| Use this color legend to interpret the preceding hazard map. Each color represents expected height of inundation or flooding in meters. |
Looking at the Main Population Centers
Like most natural phenomena, tsunamis will cause significant harm mostly to areas where there are concentrations of human habitation. This is why Phivolcs has made available its hazard maps to local governments which can, in the event disasters do occur, execute plans to mitigate or reduce the effects of these natural phenomena to human lives.
At this point, we shall look at “zoomed in” or enlarged portions of the map to see how prone population centers are to any tsunami that may be generated by a significant quake from the Manila Trench.
Nasugbu
The Phivolcs Tsunami Hazard Map shows Nasugbu to be the most vulnerable if a tsunami does occur due to a significant movement of the Manila Trench. The map shows inundation or flooding of as high as 6 meters (almost 20 feet) reaching well into the town’s poblacion.
 |
| The Phivolcs Tsunami Hazard Map shows the entire poblacion of Nasugbu inundated with water as high as 6 meters. |
So that readers may better appreciate the inundation such a tsunami can cause, below is the same map superimposed on a satellite image from Google Earth.
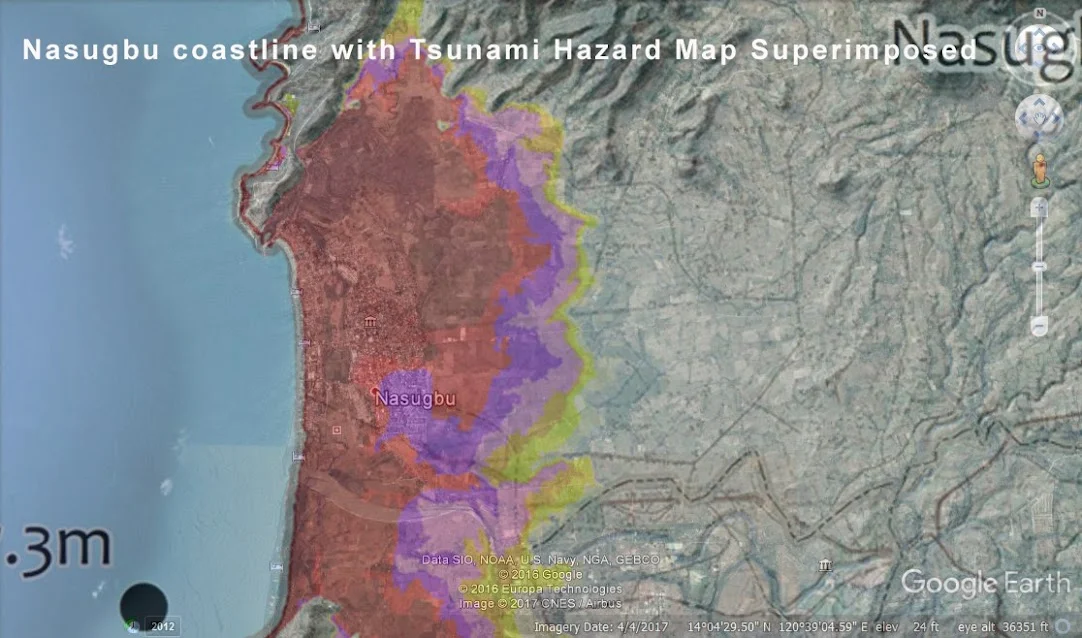 |
| Part of the Phivolcs Tsunami Hazard Map superimposed on a Google Earth image to show how far inland tsunami waters can inundate. |
Lian
Waters as high as 6 meters will also reach Lian, but the town proper will be hit by slightly lower inundation of as high as 4.9 meters (around 16 feet) in some parts and as high as 3.9 meters (almost 13 feet) in others. The water will begin to descend as it rolls past the poblacion. Below is part of the Batangas Tsunami Hazard Map superimposed on a satellite image from Google Earth.
 |
| Part of the Phivolcs Batangas Tsunami Hazard Map superimposed on a satellite image courtesy of Google Earth. |
Calatagan
The coastal areas on both sides of the Calatagan Peninsula are vulnerable to inundation of as high as 6 meters, but the poblacion itself is prone to inundation of waters as high as 3.9 meters and 2.9 meters (9.5 feet), as shown by a part of the map superimposed on a Google Earth image below.
 |
| Part of the Phivolcs Batangas Tsunami Map superimposed on a satellite image of Calatagan courtesy of Google Earth. |
Balayan
The coastal town of Balayan, with many structures almost at the waterfront, is vulnerable to inundation of 6 meters, 4.9 meters and 3.9 meters, as shown by part of the Batangas Tsunami Hazard Map superimposed on a Google Earth Satellite image below.
 |
| Part of the Phivolcs Batangas Tsunami Hazard Map superimposed on a satellite image of Balayan courtesy of Google Earth. |
Lemery
Poblacion Lemery, like Balayan very close to the shore, is also prone to inundation of as high 6 meters and 4.9 meters, as shown by the superimposition of part of the Batangas Tsunami Hazard Map on a Google Earth image of the municipality.
 |
| Part of the Phivolcs Batangas Tsunami Map superimposed on a Google Earth image of Lemery. |
Batangas Bay
Coastal areas in Bauan, San Pascual and Batangas City are prone to inundation of as high 4.9 meters, 4.9 meters, 2.9 meters and 1.9 meters, depending on the locality. This can be seen from the Google Earth map below with part of the Batangas Tsunami Hazard Map superimposed.
 |
| Part of the Batangas Tsunami Hazard Map superimposed on a Google Earth Map of Batangas Bay. |
2 “Philippine Institute of Volcanology and Seismology, Tsunami Hazard Map of Province of Batangas. [Map] Version 1. 1:130,000. Quezon City, Philippines: Phivolcs, January 2017,” online at the Phivolcs web site.
3 The United States Geological Service or USGS defines a fault as “a break in the rocks that make up the Earth’s crust, along which rocks on either side have moved past each other.”
4 According to the USGS, shallow earthquakes are those that occur between 0 and 70 kilometers in depth. Shallow-depth earthquakes tend to be felt with higher intensity on the surface and also tend to be more destructive than earthquakes that occur deeper under the ground.
5 An oceanic trench is a deep and long topographic depression of the sea floor. The Manila Trench is one such oceanic trench due west of Luzon that reaches down to a depth of 5,400 meters or 17,700 feet. Wikipedia.
6 “Interferometric synthetic aperture radar” is a radar technique used to map surface deformations. Wikipedia.